| Flow (in cfs) - last revised Feb 29, 2024 | ||||||||||
|---|---|---|---|---|---|---|---|---|---|---|
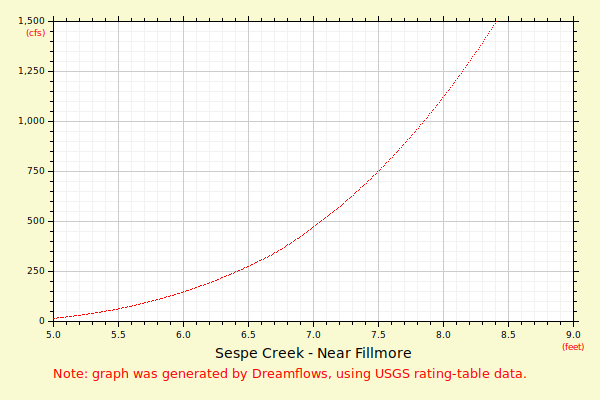
| Height (feet) | .0 | .1 | .2 | .3 | .4 | .5 | .6 | .7 | .8 | .9 |
| 4 | 0 | 0 | 1 | 2 | 4 | 7 | 10 | 15 | ||
| 5 | 21 | 28 | 36 | 45 | 56 | 68 | 82 | 97 | 114 | 133 |
| 6 | 153 | 175 | 199 | 224 | 252 | 282 | 313 | 347 | 387 | 430 |
| 7 | 476 | 526 | 579 | 635 | 695 | 758 | 825 | 895 | 969 | 1047 |
| 8 | 1129 | 1216 | 1306 | 1401 | 1499 | 1603 | 1711 | 1823 | 1940 | 2062 |
| 9 | 2189 | 2321 | 2458 | 2600 | 2747 | 2899 | 3057 | 3221 | 3390 | 3564 |
| 10 | 3744 | 3931 | 4123 | 4321 | 4525 | 4735 | 4952 | 5174 | 5404 | 5639 |
| 11 | 5882 | 6131 | 6387 | 6649 | 6919 | 7195 | 7479 | 7769 | 8067 | 8373 |
| 12 | 8685 | 8938 | 9196 | 9458 | 9744 | 10039 | 10340 | 10647 | 10960 | 11279 |
| 13 | 11604 | 11936 | 12274 | 12619 | 12970 | 13327 | 13691 | 14062 | 14440 | 14824 |
| 14 | 15215 | 15613 | 16018 | 16430 | 16850 | 17276 | 17710 | 18150 | 18599 | 19054 |
| 15 | 19518 | 19988 | 20467 | 20953 | 21446 | 21948 | 22457 | 22975 | 23500 | 24033 |
| Height (feet) | .0 | .1 | .2 | .3 | .4 | .5 | .6 | .7 | .8 | .9 |
| 16 | 24575 | 25124 | 25682 | 26249 | 26823 | 27406 | 27998 | 28598 | 29207 | 29824 |
| 17 | 30450 | 31085 | 31729 | 32382 | 33044 | 33715 | 34395 | 35085 | 35783 | 36491 |
| 18 | 37209 | 38128 | 39063 | 40013 | 40979 | 41961 | 42958 | 43971 | 45000 | |